Editor's note: This blog is part of a series originally published on Rubikloud's blog, "kernel." Kinaxis acquired Rubikloud in 2020.
At Rubikloud, our wonderful Operations team regularly plans fun activities that the whole company can participate in such as movie nights, ceramic painting, and curling to name a few. However, my favorite activity by far is visible as soon as you get off the elevator.
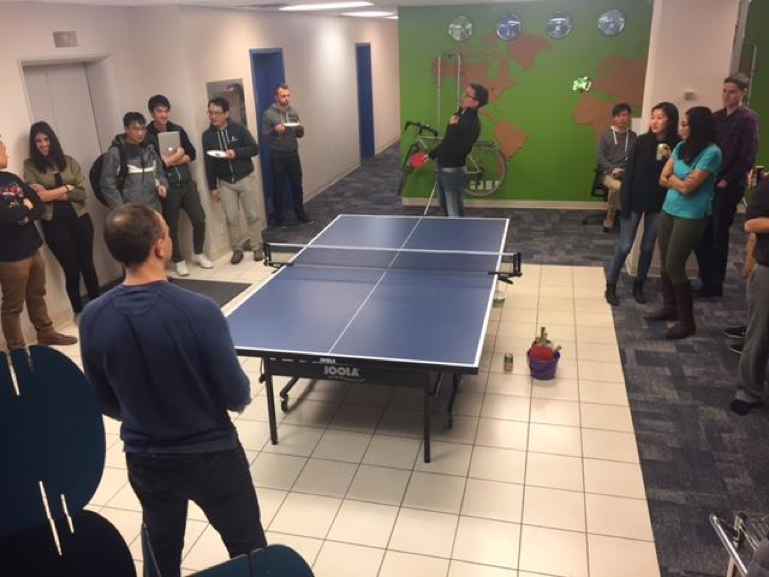
 Championship match at our annual ping pong tournament
Many of our Rubikrew are big fans of table tennis, in fact, we’ve held an annual table tennis tournament for all the employees for three years running (and I’m the reigning champion). It’s an incredibly fun event where everyone in the company gets involved from the tournament participants to the spectators who provide lively play-by-play commentary.
Unfortunately, not everyone gets to participate either due to travel and scheduling issues, or by the fact that they miss the actual tournament period in the case of our interns and co-op students. Another downside is that the event is a single-elimination tournament, so while it has a clear winner the ranking of the participants is not clear.
Being a data scientist, I identified this as a thorny issue for our Rubikrew table tennis players. So, I did what any data scientist would do and I built a model.
Note: If you’re not too interested in the math, just skip over the next section to see how we implemented it.
Bradley-Terry Model
The Bradley-Terry model [1] is a popular statistical model that can be used to predict the outcome of anything that involves comparisons. For example, a variation of this model is used in the popular Elo chess ranking system.
In the case of our table tennis ranking, we wanted to build a model that could give the probability that player
In more detail, the Bradley Terry model2 defines a parameter for each player,
If we can estimate each
Fitting the Bradley-Terry Model via the MM Algorithm
We can fit this model by defining its likelihood function and finding the
the likelihood is this expression over all pairs of players:
where
Unfortunately, it gets a bit messy if we try to optimize this function directly. However, there is a clever little trick where we can iteratively optimize another objective function that will converge to the same optimum as Equation 3. If we notice that for positive
with equality if and only if
A function that satisfies Equation 5 is said to minorize
This condition suggests an iterative algorithm to compute
- Select some arbitrary initial value for
p(0) - Normalize
p(k) such that∑Ni=1p(k)i=1 - Maximize
p(k+1)=argmaxp Qk(p) - Repeat step 2 and 3 until convergence
In fact, this is a more general set of algorithms call minorization-maximization or MM algorithms.
Fortunately, Equation 5 is much easier to maximize because
where
As it turns out since our original likelihood is convex, our MM algorithm will eventually converge to the global optimal solution (if it exists). I would advise you to check out [2] if you’re interested in these details.
Adding a Prior to the Bradley-Terry Model
One of the drawbacks of the vanilla Bradley-Terry model is that it is ill-defined for some common conditions. Namely, there must be a chain of wins from any player
Furthermore, if you have only a player who has either won or lost all their games, the vanilla model Bradley-Terry model falls apart. As usual with these types of situations, we can add a Bayesian prior on the situation (or if you like regularization) to handle these ill-defined cases [3].
Formulating this model as Bayesian problem, we can write the posterior distribution for our
where we’re using
That is, if we hypothetically introduced a dummy player that has exactly
The Official Rubikloud Table Tennis Rankings
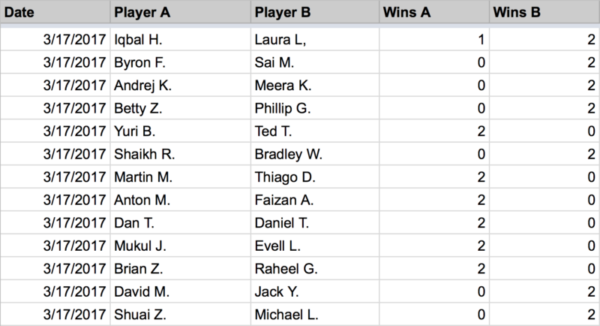
While it’s fun to work out the math, it’s even more fun to implement it. First, I set up a Google spreadsheet to record our game history and then shared it with the entire company:
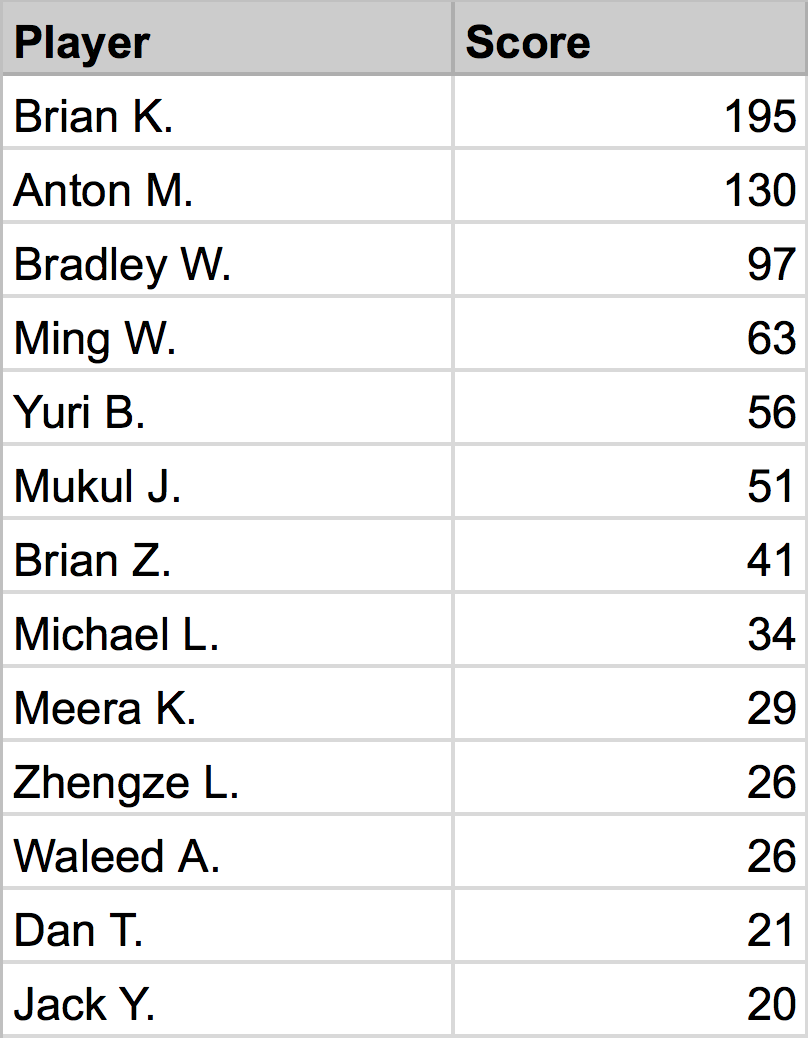
Each person was responsible for putting their game record in the sheet. We used a very simple record format: date, player A, player B, win A, wins B. Next, I wrote a little script in Python using gspread and the Google drive API that reads in the game records, computes the rankings above (normalizing between 1 and 1000), and then writes it out to another tab in the spreadsheet. The code is up on my GitHub account: https://github.com/bjlkeng/Bradley-Terry-Model.
You can see it in action here:
Official Rubikloud Table Tennis Ranking
The script runs on a cronjob hourly so that players can get the most up-to-date results. So far, the reception has been positive (with respect to table tennis, maybe not productivity :P), our Rubikrew players are now playing with a wider variety of opponents more often (to move up the rankings).
References
[1] Bradley-Terry Model (Wikipedia)
[2] “MM Algorithms For Generalized Bradley–Terry Models”, David R. Hunter, The Annals of Statistics 2004, Vol. 32, No. 1, 384–406
[3] “Using Bayesian statistics to rank sports teams”, John T. Whelan, [presentation]
Footnotes
- We used games instead of matches because we don’t have a standardized match format.
- Some texts will reparameterize Equation 1 by using setting
pi=eβi , which conveniently transforms Equation 1 into a logistic regression:logit(P(i>j))=βi–βj .


Discussions
Thank you.
Leave a Reply